A Theory of Change Approach for Measuring Economic Welfare Beyond GDP
Christine Corlet Walker, Simon Mair and Angela Druckman
CUSP Working Paper Series | No 10

Summary
It is widely acknowledged that Gross Domestic Product (GDP) is not a suitable measure of economic welfare, and many attempts have been made to develop more appropriate metrics. Such ‘beyond GDP’ measures show the benefits of taking a more diverse approach to measuring economic progress. However, they often lack a theoretical basis for deciding which welfare indicators to include in addition to, or instead of, GDP. This can lead to the problematic conflation of the inputs and outputs of economic processes. To address this issue, we propose a novel framework for indicator development: the ‘Theory of Change’ approach. ‘Theory of Change’ is a causal model in which the relationships between system inputs, activities, outputs and outcomes of the economy are explicitly articulated, and can be used to identify theoretically sound indicators for economic welfare. In this way the Theory of Change approach places emphasis on understanding both what economic welfare is valued by society, and how it is generated. This focus on understanding the relationships between the elements of the model can also help to identify levers for improving system outcomes. A further advantage of the approach is that it enables the assessment of more difficult to define and measure factors impacting on economic welfare. We illustrate and discuss these features in relation to the sharing and creative economies.
1 Introduction
Gross Domestic Product is not a good measure of economic welfare. It does not distinguish between economic activities that increase welfare, and those which reduce welfare; it does not account for the distribution of income, access to public goods and services, or rights and privileges; and it does not account for the benefits of non-market activity. These faults, and more, are well documented (Brinkman and Brinkman 2011; Kubiszewski et al. 2013), Moreover, they should not come as a surprise: the European Commission (2008, p. 98) manual for compiling national accounts (the statistical basis of GDP), states that they “are not compiled simply, or even primarily, to produce indicators of welfare”. The result of these failings is that GDP is unable to capture many aspects of societal welfare. Consequently, there is a strong argument for refocusing societal progress away from GDP growth, particularly as new forms of economic activity emerge (Stiglitz et al. 2009; Fleurbaey 2009; Coyle and Mitra-Kahn 2017, Jackson 2017).
Currently, the rapid growth of the sharing economy and the creative economy are highlighting the problems with using GDP as a measure of welfare. The sharing economy can be defined as any economic activity in which an online platform facilitates peer-to-peer sharing of an otherwise under-utilised capital asset or skill (e,g. ONS, 2016a). Likewise, the creative economy is defined as economic activity based on individual creativity (DCMS 2016, Coyle and Mitra-Kahn, 2017). The national accounting framework of GDP struggles with measuring the contributions that the sharing economy and the creative economy make to economic welfare because they much of their activity takes place outside of the market and state. As a result, much of the value they generate cannot be meaningfully monetised. These challenges are not new, but their re-emergence underlines the need to develop a more appropriate measure of societal progress.
1.1 Beyond GDP
Many ‘beyond GDP’ measures have already been developed. These range from those which implement minor adjustments to GDP (e.g. Genuine Savings, developed by Hanley et al. 2015), to indices that contain a full suite of social and environmental welfare indicators. Examples of the latter include the Index of Sustainable Economic Welfare (Cobb and Daly 1989, Jackson et al., 2009), the Social Progress Index (Porter et al. 2014), and the Happy Planet Index (Abdallah et al. 2009). Many of these indicators have made important contributions to the question of how to measure welfare. They have established methodologies for valuation and data collection across many key indicator areas (Kubiszewski et al. 2013; Porter et al. 2014). Crucially, they have also helped to operationalise the idea that economic welfare is better measured through a wider variety of factors than can be captured in the national accounts alone. No existing indicator, however, allows us to both track the progress of the economy and to understand how that progress is generated: something which is very important if the indicators are to be used in decision-making.
In part, the inability of ‘beyond GDP’ indicators to reveal how societal welfare is generated comes either from a lack of theory underpinning the initiatives, or a lack of transparency in developing and communicating this theory. For example, the processes for selecting sub-indicators to include in a composite indicator, and for deciding which types of indicator to include, vary widely (Yang 2014). Moreover, this issue receives relatively limited attention within the indicator development literature, with some authors simply referencing researcher ‘judgement’ as the primary indicator selection tool (Saisana and Tarantola 2002). When there is no theory, it can be impossible to be sure that a given indicator is measuring the most appropriate components of societal welfare. To overcome this issue some authors have developed representations of the economy which explicitly consider the system flow from inputs to outputs (Dutta et al. 2012; Porter et al. 2014). However, these are often simplistic and do not present the level of detail required to allow a user to really understand the processes at work. As such they remain relatively opaque and do not constitute full communication of how economic welfare is generated from the outputs.
A lack of transparency in the theory underlying indicators is problematic because it negates their primary benefits. For example, when dealing with composite indicators, a lack of theoretical basis (and/or a lack of transparency) for the selection of sub-indicators is problematic because different aggregation procedures, weightings and selection of indicators can lead to dramatically different reported results (Grupp & Mogee 2004, Mair et al., 2017). Without a clear theoretical explanation of the indicators used, it may be nearly impossible to see how or why two apparently similar indicators arrive at different results, with different implications for policy. Likewise, indicators enhance our understanding of a system only if we understand what a change in the indicator actually means. This requires a strong theoretical link between the indicator and the wider system, and for this link to be transparent. In short, two of the key advantages of quantified indicators (their ability to clarify how concepts are being operationalised and to enhance our understanding of a system; Mair et al., 2017) relies on the presence of a theoretical basis for the indicator, and for this basis to be visible and transparent.
1.2 Aim and structure of this paper
In this paper, we argue that the ‘Theory of Change’ approach could be used to develop a composite indicator of economic welfare that overcomes some of the issues associated with GDP and other indicator initiatives by focussing on developing and depicting theoretical explanations of economic welfare. The Theory of Change provides a transparent and robust framework capable of producing a defensible and consistent theory of societal welfare, from which a composite welfare indicator could be developed. The transparency of the Theory of Change framework comes from its diagrammatic approach (described in more detail in Section 2). Users start with their ultimate goal in mind – the concept they are trying to measure. They then follow a structured process that takes them backwards from this ultimate goal to the changes and inputs required to achieve it. At each stage of the diagrammatic process, users reflect on and make explicit their theories for how the ultimate goal will be affected. The resulting diagram explicitly illustrates flows of impact and allows aggregate scores to be decomposed into their constituent parts and geographic scales, as needed. On these grounds, we argue that the Theory of Change approach offers a promising framework for developing a new indicator of economic welfare.
The rest of this paper is structured as follows. In Section 2 we introduce the Theory of Change approach, its current applications, strengths and weaknesses. In Section 3, we illustrate the potential of the Theory of Change approach by discussing how it might be applied to the sharing and digitally enabled creative economies. Here we focus particularly on the ways that the Theory of Change framework is better able to capture the contribution of difficult to define and measure elements of these types of activity. Section 4 concludes with a discussion of further work required for implementation.
2 Theory of Change: a new framework for indicator development
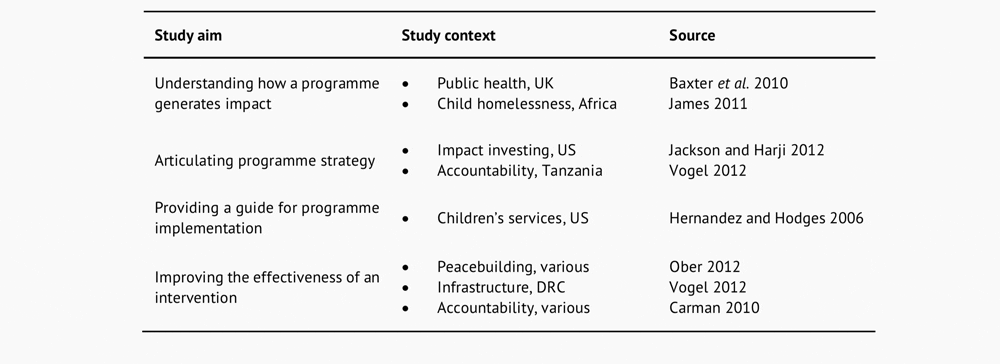
The Theory of Change is a framework that seeks to explain what impact is created by a programme or system, and how that impact was generated (Blamey and MacKenzie 2007). It has its roots in a number of disciplines, including programme analysis, logic planning models and informed social practice (Stein and Valters 2012) and has been widely applied in programme evaluation (Table 1). Causal flow models – similar to those developed through Theory of Change – have previously been used within the environmental sciences to address the need for a “consistent and comprehensive framework” (van Oudenhoven et al. 2012, p. 111) for indicator selection (Niemeijer and de Groot 2008; van Oudenhoven et al. 2012). Transferring this approach to devising a theory of how economic welfare is generated will support the selection of sub-indicators that are both theoretically consistent, and technically sound.
2.1 An Overview of the Theory of Change
The Theory of Change takes the form of a diagram or flow chart depicting the relationships between the different components of the system, along with a narrative description of how the components of the diagram are linked. To help structure the diagrammatic process, and to aid in making links to decision making processes, the Theory of Change framework is structured around five components: Inputs, change mechanisms, outputs, outcomes and impacts. Figure 1 provides definitions of each of the components of a Theory of Change diagram, together with a brief example. Theory of Change diagrams should be read like a flow chart, from left to right, with the boxes in one column explaining those to which they connect in the next. In Theory of Change diagrams, the first column of boxes are inputs to the system, and are required to create the change mechanisms in the second column. The change mechanisms then influence the outputs, which in turn influence the outcomes, and finally the impact. In the example in Figure 1, the input is human capital. Sufficient human capital allows the provision of accessible education, which is the change mechanism enabling more individuals to enrol in higher education (the output). More individuals enrolled in higher education boosts the adult literacy rate (the outcome), which has a positive effect on social welfare (the impact).
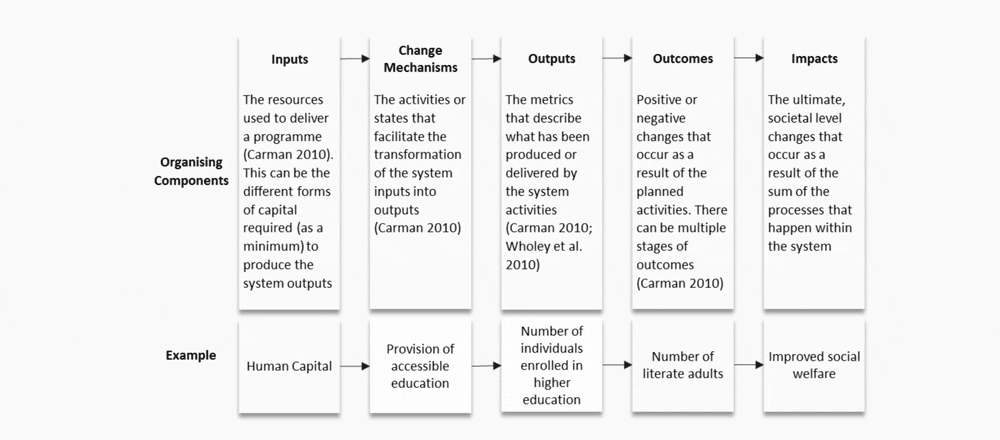
The diagram is analogous to a model: it must balance the need to comprehensively describe system behaviour with the pragmatism of having to actually populate and use the diagram in decision making. Nonetheless, a well-designed Theory of Change should be sufficiently comprehensive that, if activities A, B and C are all implemented it is reasonable to expect that outcomes X, Y and Z will occur (Connell & Kubish 1998).
This expectation draws upon two theories: implementation theory and programme theory[i]. Implementation theory seeks to explain how a programme’s activities transform its inputs into its outcomes. It assumes that there is some explicit or implicit theory which can identify the inputs required to deliver a set amount of the activity, which will define the quantity of outputs produced (Blamey and MacKenzie 2007). Programme theory, by contrast, seeks to explain how the direct outputs from a programme might then go on to drive additional outcomes (Blamey and MacKenzie 2007). This is related to how individuals or systems respond to the activity outputs. In the example of Figure 1: how likely an adult is to be literate, given that they participated in 10 years of schooling. This theory-based approach to programme evaluation supports programme managers and strategists to identify and highlight important, evidence-based pathways to impact. Although there is more uncertainty about how an initiative or activity will create change at a societal level, being transparent about the quality and strength of evidence underpinning the relationships within the Theory of Change framework will enable this to be taken into account in decision-making.
In the context of measuring the ‘success’ of an economy, we propose treating the economy, and society more broadly, as a programme of change. Theory of Change approaches are more traditionally applied to localised programmes of change. However, the economy shares many of the same features as local programmes, including:
- a series of ‘ultimate goals’. We may argue about exactly what the ultimate goals of the economy are, but governments and other economic actors would generally agree that they are aiming to make society better and to improve the lives of the general public. Governments that take sustainable development seriously may also include a provision that this must not be achieved at the expense of future generations,
- ‘change activities’: actions that contribute to achieving these goals (e.g. provision of education and healthcare),
- and inputs from multiple actors into the system, which facilitate the delivery of the change activities.
By considering society as a programme of change in this way, we can develop a theory of how economic welfare is generated though the activities that occur within the economy, and as a result of the inputs that are injected into the system.
However, this should not be taken to mean that the flow of impact in the economy is considered linear within the Theory of Change approach. Even in material terms there are, of course, non-linearities due to the input-output structure of the economy. This remains true for the flow of outcomes and impacts within an economy; for example, increased time spent volunteering by a community might enhance community cohesion, which in turn might feedback to increase the time spent volunteering by the community. The flows within the diagram (shown by the arrows between boxes) should, therefore, be taken to represent the primary pathways of impact. Non-linearities, or feedback loops, can then be represented either through the assumptions underpinning the diagrams or through explicitly visualised feedback loops in the diagram (see section 4.2 for an example).
2.2 Strengths and Weaknesses of Theory of Change
The Theory of Change approach has a number of general benefits for indicator development. In particular, it encourages participation and collaboration of a wide variety of stakeholders (e.g. Connell and Kubisch 1998; Shapiro 2006; Carman 2010). The participatory development of indicators is particularly useful in ensuring the indicator represents a holistic view of the system in question, because different stakeholders bring different worldviews and perceptions of the system (Bell and Morse, 2008; Mair et al., 2017). Additionally, some believe that using a Theory of Change approach focuses the implementation of a programme by ensuring intended outcomes are clearly defined and the activities needed to achieve those outcomes are identified (Connell and Kubisch 1998). Practitioners tend to support this view, saying that the Theory of Change approach “strengthen[s] the clarity, effectiveness and focus of programmes” (James 2011, p. 4).
In the more specific context of developing measures of economic welfare, using a Theory of Change approach has three primary benefits. First, it supports the selection of consistent and defendable measures of economic welfare across all economic sectors. Theory of Change achieves this by selecting clear ‘moments’ in the socio-economic process for measurement; in essence saying, this is the cross section at which we wish to measure the welfare being delivered. For example, let us take the inputs currently being delivered into the system as a reflection of the current state of societal welfare, or let us take the outcomes as the best reflection of the current welfare of society. In being explicit about the inputs, outputs or outcomes of the system, Theory of Change ensures that composite indicators designed from the framework do not mix the three. This avoids issues of double-counting. For example, expenditure on education might also feed into health outcomes, so an index which includes both might be double-counting some of the welfare delivered by education expenditure. Second, the theory embedded within the approach can be used to understand how and why outcomes are generated. This detailed information about the mechanisms of change can enhance the application of theory into practice (Shapiro 2006), help focus resources on key impact pathways (Carman 2010), and support decision-makers to identify avenues for change or improvement (Weiss 1997; Connell and Kubisch 1998). Third, a composite indicator that is supported by a comprehensive, justifiable Theory of Change framework provides the accessibility and comparability of a single measure, with the depth of information required to make detailed policy decisions. This directly addresses the issue that aggregated measures, which represent complex, heterogeneous systems, can hide important trends or relationships (Tepper 2002).
However, limitations of the methodology should be acknowledged. Stein and Valters (2012) highlight a potential tension involved in using a Theory of Change approach to drive evidence-based policy: Theory of Change approaches often rely on “conceptualisation and narrative” rather than on evidence. This clearly points to a need to better categorise the types of evidence used in Theory of Change development, and transparency in both the Theory of Change development process and the assumptions underlying the connective elements of the model. This limitation is particularly pertinent to our application of the Theory of Change approach because of the explicit intent to drive policy development, and because of the need for public accountability. The success of the Theory of Change approach in this context is, therefore, likely to be largely dependent on stakeholders’ willingness to invest time and effort developing “plausible, doable, and testable” Theory of Changes with a strong evidence base (Connell and Kubisch 1998, p. 12).
3 First Steps Towards a Theory of Change Approach to Economic Welfare
In this section we present an illustrative description of how the Theory of Change might be used to create an indicator of economic welfare. Theory of Change diagrams presented here and throughout the paper are illustrations only, full study design procedures have not been followed. Theory of Change study design guidelines have been laid out in texts like Funnell and Rogers 2011’s Purposeful program theory: Effective use of theories of change and logic models. In a more complete application of the Theory of Change we would need to more closely follow these guidelines from the literature, including factors in the development process such as: more participative approaches to develop the framework, expert focus groups to validate the indicators included in the diagrams; a detailed account of the empirical evidence underpinning the causal relationships between the boxes in the diagrams; and a list of assumptions supporting the diagrams. Here, however, we use the diagrams and brief accompanying narratives to provide an overview of how the Theory of Change might be applied and to demonstrate its core strengths – transparency and elaboration of a theory of change. The diagrams presented here do not constitute a comprehensive theory of economic welfare, but we hope that they display a coherent logic, and transparency such that those who disagree with decisions we have made will be able to 1) see our justifications for these choices and 2) say specifically where and why they disagree with us.
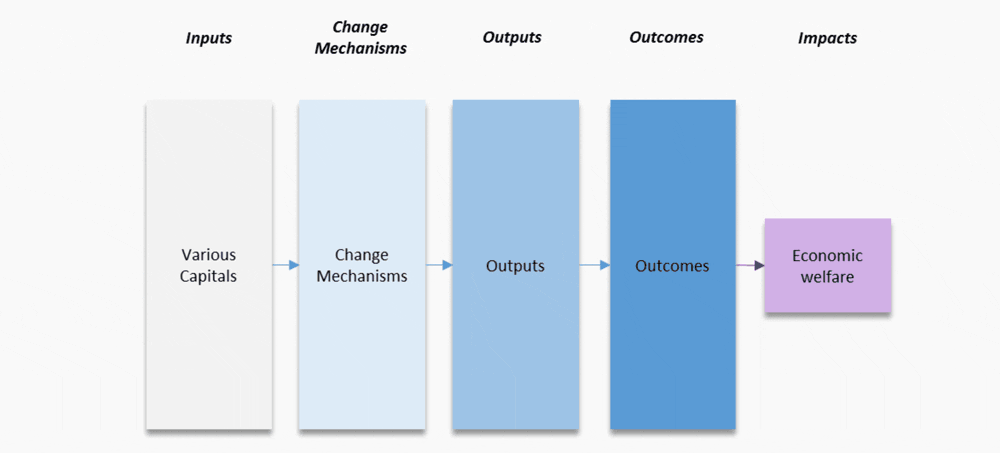
When constructing a theory of change we start from our ultimate goal, in the terminology of the Theory of Change, the Impact. As we are interested in developing an indicator of economic welfare, economic welfare enters our Theory of Change diagram under the Impact heading (Figure 2).
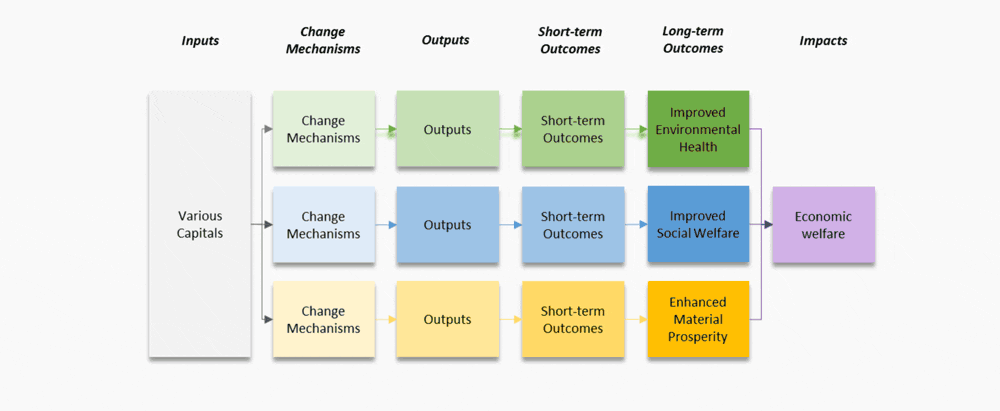
Working back through the Theory of Change diagram process, the next step is to define the outcomes (the changes in the system) that are needed to realise this impact. Following many beyond GDP initiatives, we understand ‘economic welfare’ as broadly in line with the three-pillar approach to sustainability (e.g. Bleys 2012). So economic welfare is the result of environmental health, social welfare, and material prosperity, which are the long-term outcomes of the system (Figure 3). Although this kind of ‘triple bottom line’ approach is well established (see, for example, Dodds and Venables, 2005; Stiglitz et al., 2009; Bleys, 2012), to give a feel of the process of applying the Theory of Change framework, it is worth outlining the accompanying narrative linking Economic Welfare to these three outcomes. This is done in Box 1.
Box 1
Narrative Accompanying Figure 3: Linking Economic Welfare and the Three Pillars of Sustainability
In brief, we are defining economic welfare as the ability to live good lives now and in the future, and this is not possible without each of the three pillars. First, environmental health impacts economic welfare because the environment provides the basis for all life: environmental health outcomes represent the ability of the planet to sustain us. Second, material prosperity is our ability to transform environmental resources into the material goods and services needed to live comfortably. At the extreme, without shelter or food production there is no economic welfare. Similarly, production of books, videogames, and care services add to our collective ability to live well. We should note, however, the large body of work demonstrating that endless increases in ‘material prosperity’ does not necessarily lead to increases in economic welfare (Daly, 2007; Jackson, 2017). Rather, a satisficing approach may be required here, where we have enough but not too much. This is a theme we return to in Section 4. Defining our ‘material prosperity’ outcome in this way aligns it with what would more usually be called ‘economic’ outcomes. Similarly, our ‘social welfare’ outcomes represent what Stiglitz et al., (2009) refer to as the ‘non-economic’ aspects of life. In other words, the non-material things that are important to our welfare (for example, our relations with others, our health, and our happiness). The division between the social and material aspects of economic welfare is a result of what Polanyi (1947) calls the ‘market-mentality’: the privileging in market-economies of ‘economic’ motives (like hunger and gain) over ‘non-economic’ motives (like love and pride). Given that most societies are market-economies, it makes sense for analytical purposes to separate these two concerns in our measurements. But just as economic welfare depends on environmental health, it must also depend on both material and social concerns, and so all three must enter any exploration of ‘Economic Welfare’.
At this point we must start to simplify our exposition of the method. This is because the complexity and detail of the diagrams now begins to grow rapidly: as each additional element of the Theory of Change diagram is filled in, more information is added. This provides richness, but within the confines of an academic paper can be overwhelming. In a complete application, the appropriate level of detail will be determined by the desired application of the framework, trading off data collection capacity against the need to create a realistic representation of the system. Our larger Theory of Change diagrams can be found in the appendix, though it should be noted that these are also illustrative, and incomplete. From here we will only show parts of the larger diagram.
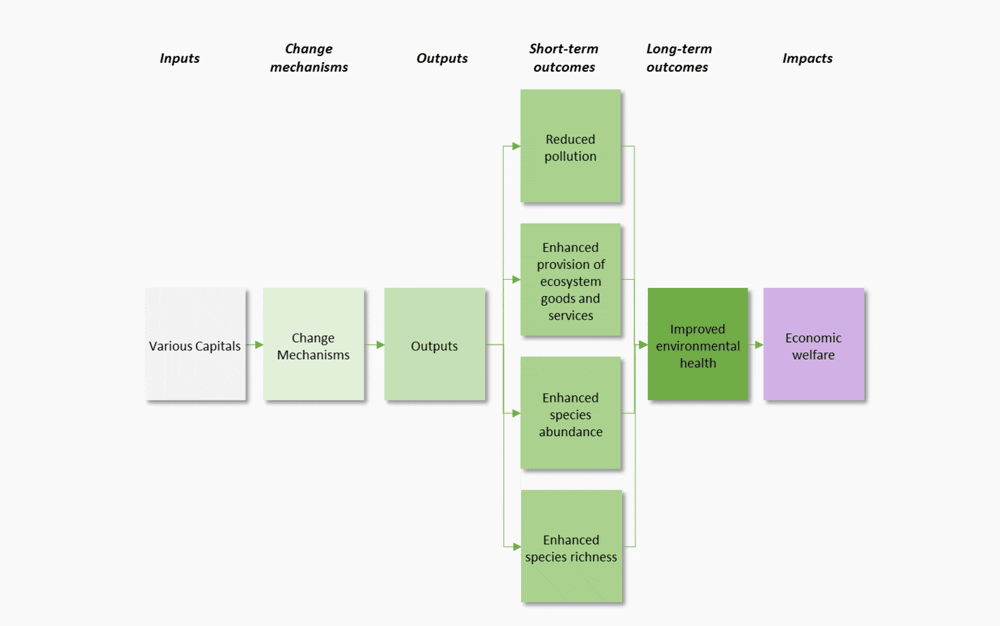
Figure 4 shows an indicative set of short term outcomes expected to lead to improved environmental health. The accompanying narrative is found in Box 2.
Box 2
Narrative Accompanying Figure 4: Outcomes for Environmental Health
In choosing the short-term outcomes we have taken an anthropogenic view of what constitutes environmental health. In this way we are close to human centred frameworks such as the planetary boundaries framework or the sustainable development goals (Rockström, et al., 2009; United Nations, 2015). Although the four short-term outcomes listed are far from exhaustive, there is substantial evidence to link each of them to an improved environment from a human perspective. For example, numerous studies link improved ecosystem services to increases in various measures of economic welfare (King et al., 2014, Zorondo-Rodrıguez et al., 2016). Similarly, chemical pollution and biodiversity loss have substantial impacts on key planetary systems that support human activity (Rockström, et al., 2009; Clift et al., 2017).
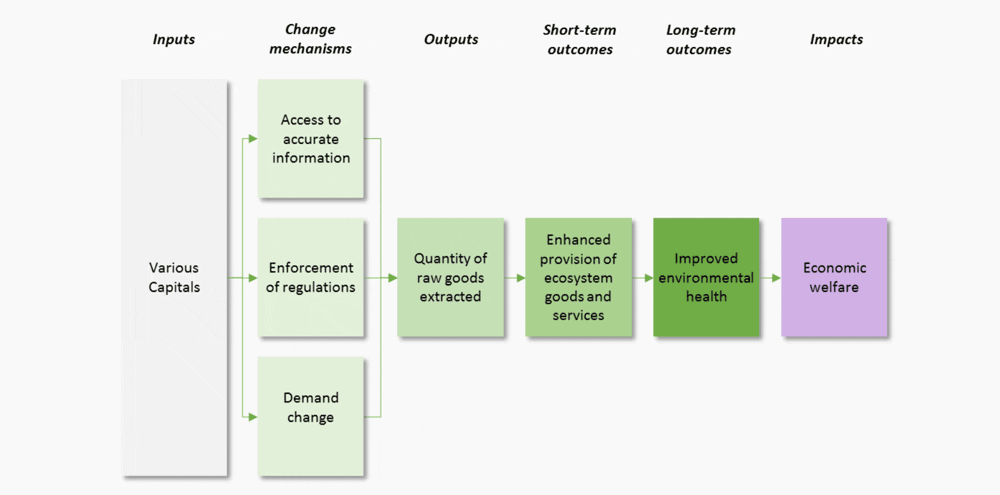
Figure 5 now adds an output and several change mechanisms to our diagram. These are added to the diagram simultaneously because outputs are the metric describing the results of change mechanisms, and so they can be difficult to separate.
Box 3
Narrative Accompanying Figure 5: Change Mechanisms and Outputs for Enhanced Provision of Ecosystem Goods and Services
Enhanced provision of ecosystem goods and services relies on their being a sustainable level of extraction of any given ecosystem service. The diagram depicts our assumption that achieving a sustainable extraction level requires three key changes, the first of which is access to accurate information. This is necessary to establish what a sustainable extraction level is. Second is a change in demand patterns and quantities. This is a rejection of Say’s law (that supply creates its own demand), and represents a demand driven view of the economy. Following this logic, a change in demand toward more sustainable consumption will drive more sustainable production. Third, the enforcement of regulations to further ensure that only a sustainable level of extraction is maintained.
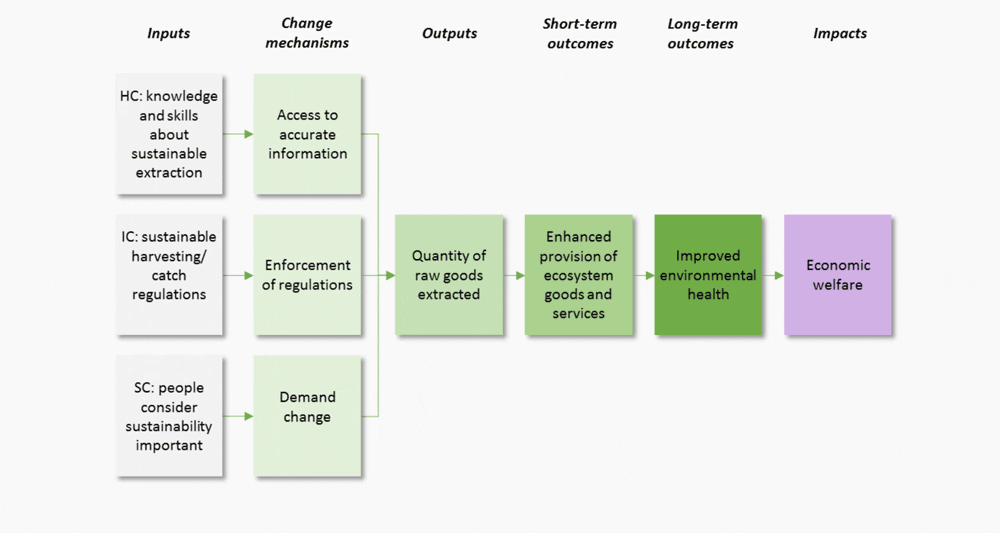
Finally, Figure 6 adds three types of capitals, one for each of the change mechanisms, the accompanying narrative is found in Box 4.
Box 4
Narrative Accompanying Figure 6: Inputs capitals required to create change for Improved Environmental Health
Adequate knowledge and skills around sustainable extraction is the minimum baseline for enabling people to access that information: it can only be accessed once it exists. Likewise, with regulation enforcement: sustainable regulations have to be in place before they can be enforced. More complex is the ‘people consider sustainability important’, which effects demand change. This comes from a model of consumer behaviour that sees values as driving action: what Jackson (2005) calls ‘internalist’ approaches to consumer behaviour change. In this paradigm, people’s attitudes towards sustainability is a key factor in their consumer decisions.
It is worth pointing out here that figure 6 highlights the trade-off between pragmatism and comprehensiveness. In reality there are many more capitals required for each change mechanism, but including them all would make the diagram unreadable. Likewise, there are feedback loops between our long term outcomes and the various capitals. Improved environmental health, for example, will improve natural capital stocks, impacting market and non-market production processes captured in the more detailed social welfare and material prosperity Theory of Change diagrams shown in the Appendix. Unfortunately, it is beyond the scope of this paper to explore fully explore these implications of this.
The process of identifying sub-indicators is well integrated into the Theory of Change approach. In the process of developing the diagrams, users can reflect on the potential to measure each element. This way, during the process of developing the diagram, a set of sub-indicators is produced on the basis of the components, or boxes, in the diagram. For example, tonnes of water pollutant per year could be one of the indicators which is selected to represent environmental health. Moreover, these sub-indicators all have defined positions in the process, and their links to the final impact are clear. These points will be further elaborated in our case study examples in Section 4.
4 Towards measurement of the Sharing and Creative Economies: Insights from the Theory of Change
Having laid out the Theory of Change approach to indicator design, we now elaborate on its strengths relative to GDP in the context of the sharing and creative economies, two of the most challenging measurement problems today.
4.1 Production Outside the Market
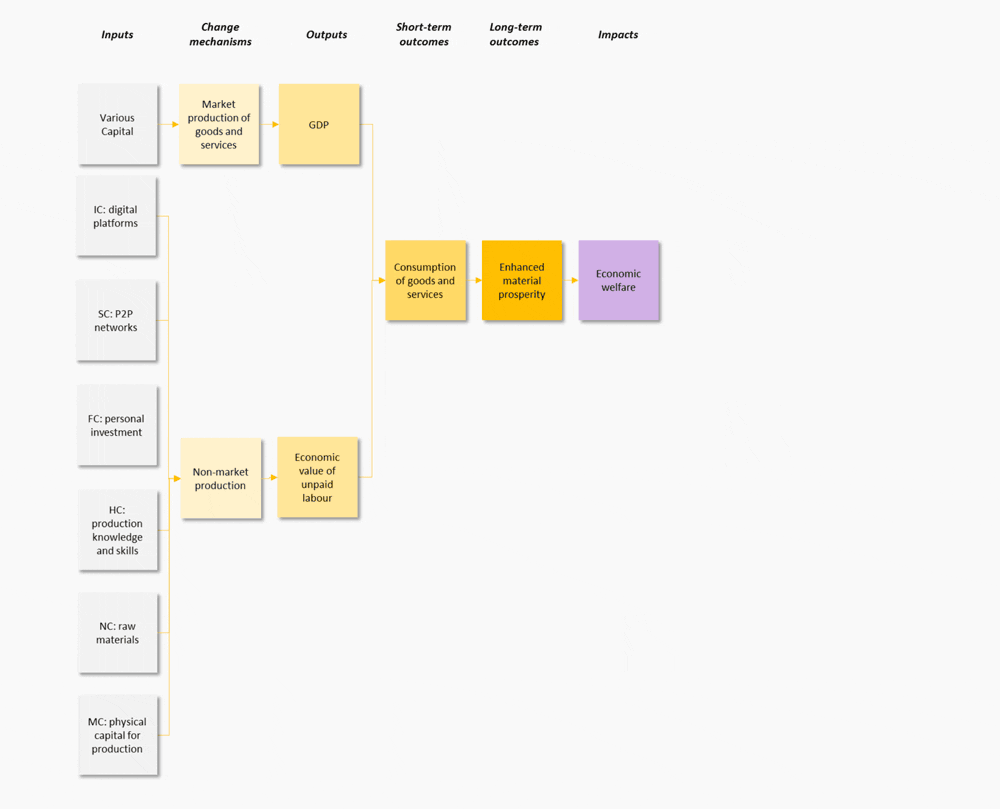
Figure 7 is an excerpt from our Theory of Change diagram (found in the appendix), highlighting the role of production and consumption in economic welfare. The core idea of Figure 7 is that economic welfare depends on our material prosperity (see Box 1, above), a key contributor to the latter is our consumption of goods and services which is determined by the sum of both market and non-market production (in Figure 7, indicated by GDP and the value of unpaid labour). The sharing and creative economies enter both parts of this equation. For illustrative purposes, let us consider the case of the sharing economy in more detail.
The sharing economy encompasses both market and non-market activity, as made clear by the definition offered by the United Kingdom’s Office for National Statistics (ONS 2016a):
“activity that is facilitated by digital platforms which enable people or businesses to share property, resources, time and skills, allowing them to ‘unlock’ previously unused or under-used assets”[ii].
For example, staying within this definition we can identify sharing economy activity in services (for example education through online platforms such as FutureLearn) as well as in physical assets, such as cars through ZipCar (Chase 2015, Coyle 2016). We can also separate out sharing economy activities on the basis of their ownership structures: the sharing economy includes both activities where assets are privately owned and where they are community owned. An example of the former is Rent the Runway (Ways to Rent 2018), a company that owns clothes and rents them to users. An example of the latter is the Vancouver Tool Library (What is the VTL? 2018), a collective community resource, where the members collectively own the tools that they share. We can also distinguish between sharing economy activities in which money changes hands (e.g. AirBnB), where there is a direct exchange of goods (e.g. Swap Style), or where things are freely given with no reciprocity required (e.g. Freecycle). This typology is summarised in Table 2.
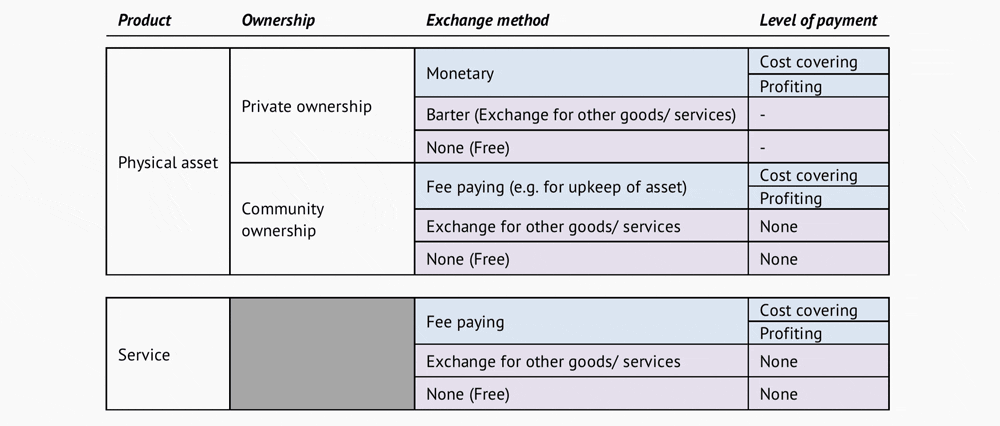
The breadth of activity represented in this typology represents a problem for GDP, but not for the Theory of Change framework. The national accounts rely primarily on the fact that most transactions in monetary economies are financial, though measures exist to capture barter markets (European Commission, 2008). More problematic is where goods and services are shared freely. Problems arise here because there may be no exchange at all (Bean 2016, ONS, 2016a, Raworth, 2017), but no exchange does not mean no consumption or production. In fact, as represented in Figure 7, total production is the sum of that produced in markets and that produced outside markets. Consequently, the sharing economy can increase consumption (and hence production) while GDP remains constant. For example, many people now visit Wikipedia instead of purchasing an encyclopaedia, this frees up money for them to spend elsewhere, and so their consumption goes up. But, their total expenditure remains constant, so GDP remains constant. Total consumption is the sum of goods purchased from the market and goods obtained outside the market. In GDP this is missed (Coyle, 2016). But, in a Theory of Change framework it can be captured.
Moreover, because outcomes are defined as the metrics describing changes in the system (in this case, non-market production), the Theory of Change approach guides us to choose a way to measure this, rather than ignoring it all together. In Figure 7 the metric describing non market production is the economic value of unpaid labour. We chose this because the parts of the sharing economy that fall under non-market production have parallels with housework and caring work. This work is principally carried out for free and is omitted from national accounts (Waring, 1988; European Commission, 2008; Saunders and Dalziel, 2017). But, in principal, someone could be paid to do this work. Consequently some beyond GDP indicators and national statistical offices have sporadically attempted to value house and care work in monetary terms. The UK Office for National Statistics (2016b) did this for the UK for 2005-2014 by imputing a value for housework based on time use surveys and earnings data. The Index of Sustainable Economic Wellbeing applies a similar approach, while noting its limitations (Daly and Cobb, 1989; Jackson et al., 2009). We suggest that a similar approach could be taken with the sharing economy: recording time spent updating Wikipedia, to return to our previous example. The formal reason that this kind of approach is not part of GDP/the national accounts framework is because including too much non-market production would “obscure what is happening on markets” (European Commission, 2008, p.6). However, this is not a problem for us, because the aim of this strand of the theory of change diagram is to estimate the total level of production, not analyse markets. By estimating the value of time spent in producing non-market sharing economy (and other) goods and services we would achieve a more complete picture of production and consumption in the economy than is possible with GDP alone.
4.2 Non-production value
Not all the value produced by the creative or sharing economies can be can be described in terms of material/production value. The Theory of Change framework has the flexibility to capture these other forms of value, GDP does not. This is not a criticism of GDP per se, but of the use of GDP as a welfare measure: GDP was never intended to capture the non-production benefits of various activities. Conversely, by starting with the intention of measuring economic welfare in its totality, the Theory of Change can do this.
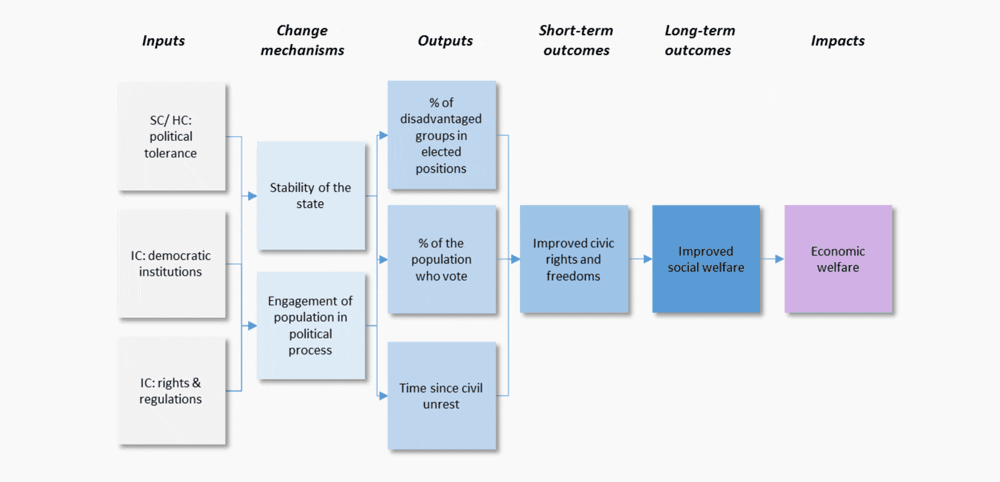
For example, Figure 8 shows the excerpt from our Theory of Change diagram (Appendix) capturing how improved rights and civic freedoms come about. The central issue for us is that this strand is able to capture some non-market benefits that flow from the creative economy. The creative economy enters this process by impacting the change mechanism “engagement in the political process”. In their comprehensive report for the UK Arts and Humanities Research Council, Crossick and Kaszynska (2016, p.7) write that by promoting reflection, helping minority groups to ‘find a voice’ (and given sufficient democratic institutions, political tolerance, and protected political rights):
“Participation in arts and culture may produce engaged citizens, promoting not only civic behaviours such as voting and volunteering, but also helping articulate alternatives to current assumptions and fuel a broader political imagination.”
In Figure 8, this translates to the percentage of socially and economically disadvantaged groups in elected positions, as well as the percentage of the population who vote. Additionally, the expansion of the political imagination, might also be captured in other Theory of Change strands. For instance, Oakley et al., (2018a) discuss the ways in which engaging with ‘new nature writing’ might help to expand of the political imagination with respect to sustainability. This would lead the creative economy to affect the inputs to the environmental health strand (discussed above in Figure 6). This potential feedback loop is shown in Figure 9.
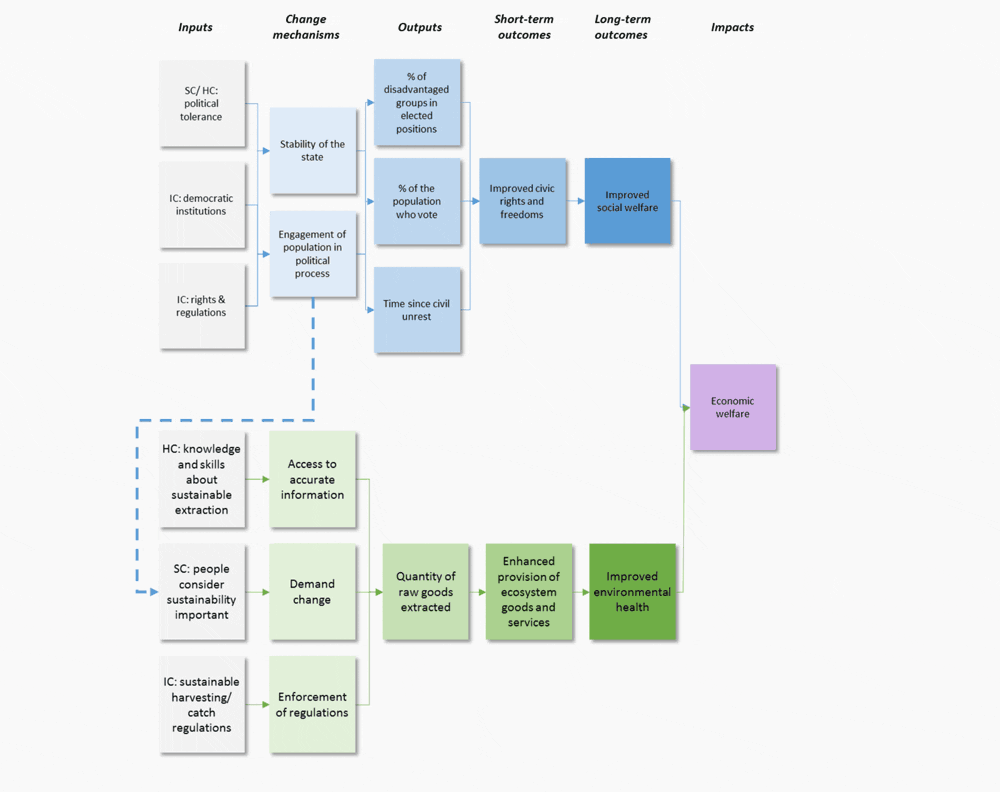
The environmental health strand depicted in Figure 6 and the bottom half of Figure 9 is also a useful illustration of the way that we can capture non-production benefits of the sharing economy. The sharing economy is a form of demand change (a change mechanism). The sharing economy represents new ways of using existing goods. This may mean a reduction in the production of goods, as existing goods are used more intensively. On the other hand, it is possible that the sharing economy enables greater levels of consumption (as discussed above), acting as a demand increase. In the next section we turn to this issue of negative impacts.
4.3 Negative Consequences.
A common critique of GDP is that it does not distinguish between economic activity that does social and environmental harm, and that which does social and environmental good. In contrast, the Theory of Change approach also provides a consistent solution to this issue.
The creative economy offers a clear example. Whether the creative economy creates positive or negative impacts is the result of the political context and particular forms of implementation of cultural activity (Oakley, 2018b). Alongside the potentially positive outcome described above, there are also potential negative impacts of the creative economy. In the case of social welfare this may be the result of enhanced gentrification and inequality (Stern and Seifert 2008), while in the case of environmental health the creative economy may increase natural resource use and pollution (Oakley, 2018b). These negative impacts are not explicitly captured in the most common creativity and innovation indices, such as the Global Innovation Index (Dutta et al. 2012). In a Theory of Change framework, however, the causal relationships within the diagram are able to reveal both the negative and positive impacts of economic activity. This is where explicitly detailing the causal relationships in the Theory of Change proves to be a significant strength over other models of indicator development.
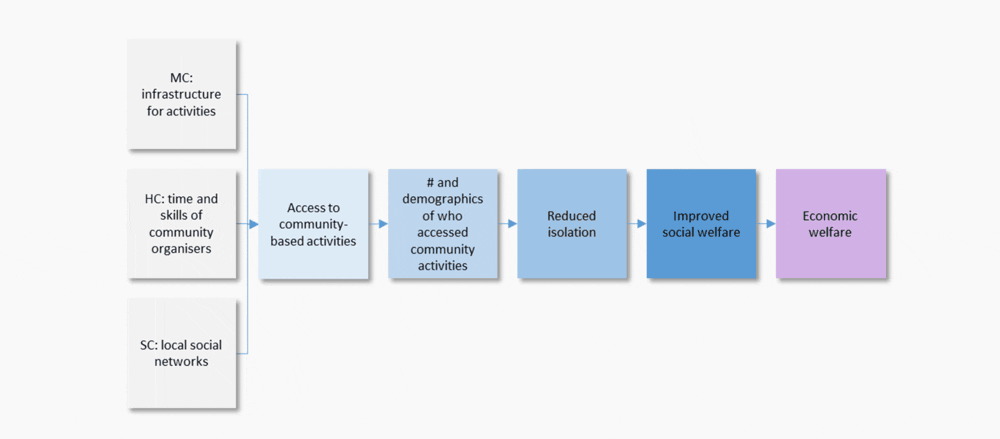
For example, Figure 10 (a part of the larger Theory of Change diagram in the Appendix) shows the reduced isolation Theory of Change diagram. The creative economy enters into the diagram in the change mechanism: access to community based activities. Community arts and culture projects will affect the form of this change mechanism. But the framework does not prescribe whether this change is positive or negative. Instead it will be assessed according to how the specific creative economy activity impacts the outcome metrics: the number and demographics of people able to access community activities.
5 Conclusion
Theory of Change presents a novel approach to measuring societal welfare; one that describes both what societal welfare is generated by economic activity, and how that welfare is generated. By emphasising transparency and development of a theoretical understanding of a system it provides a sound basis for indicator development. In this way, it offers theoretically consistent solutions to many of the problems that have plagued societal welfare measurement for many years. In particular, it can help to capture the value of difficult to measure areas of the economy, such as the creative and sharing economies. The method has a number of key strengths, including the ability to represent the system in question at different scales and levels of abstraction. This allows a trade-off to be made between creating a comprehensive measure of economic welfare and creating one that is not overly burdensome in terms of data collection. Additionally, the causal nature of the relationships within the Theory of Change diagram mean that creating composite indicators from it will offer the accessibility and comparability of a single measure, with the depth of information required to identify key pathways to impact and make detailed policy decisions.
This approach to measuring societal welfare is only as good as the rigour of the process used to develop the Theory of Change and the quality of evidence underpinning it. Hence, further research is now needed to build on the work presented here, following best practice from the field of programme evaluation in order to develop a comprehensive, defendable Theory of Change for the economy. Contributions are welcome from a range of experts to define the relationships within the model and compile the evidence underpinning it. Primary data collection may be needed in some instances to unpick the complexity of certain relationships and determine their direction and magnitude. Following this process, work could move onto the practicalities of implementing the system within national accounting frameworks.
Notes
[i] these terms are used variably in the literature. We have selected the terms as defined in Blamey and MacKenzie 2007.
[ii] We accept this definition of sharing economy as we are primarily concerned with issues of measurement, and so it makes sense to stay close to that used by statistical agencies. However, we note that this definition makes reference to online platforms, something not included in broader definitions (e.g. Schor 2014).
The paper is available for download in pdf. | Corlet Walker, C, Mair, S and A Druckman 2018: A Theory of Change Approach for Measuring Economic Welfare Beyond GDP. CUSP Working Paper No 10. Guildford: University of Surrey.

